All artwork depicting Yellowstone research beautifully illustrated by: Gabrielle Vance
I’m going to use my most recent scientific paper publishing saga to tell this story, because it’s a lot more fun to use an actual example (plus, then I get to talk about Yellowstone, which is one of my favorite things to do). This is a post that we can have multiple times over (and, in fact, we likely will). That’s because every story of scientific research is different. So while I’m writing about the trials and tribulations of traversing Yellowstone, Jess has equally interesting and vastly different stories of her own research pursuits.
Starting out: Pick a question
I study the carbon dioxide (or CO2) that is emitted through soils in volcanic areas. So, why did you pick Yellowstone, you might ask? Because Yellowstone is a volcano! In fact, it had a very large eruption over half a million years ago. The eruption was so large that the ground surface collapsed as large amounts of magma (melted rock) were removed from beneath the surface, forming what’s called a caldera.

Volcanoes are constantly emitting CO2. Or, I should say: volcanoes that still have molten magma present beneath the surface are constantly emitting CO2. This is because CO2 has somewhat of a low solubility in magma1. You can think of solubility in this case as the tendency for a gas to stay dissolved in a liquid vs. coming out of the liquid in the form of bubbles. The solubility of CO2 decreases as the pressure on the magma decreases. We can see this similarly with a bottle of soda. The liquid in a bottle of soda is under a certain amount of pressure. When you open the bottle, the liquid within it undergoes a decrease in pressure due to now being exposed to the atmosphere outside the bottle. This results in the formation of bubbles as the CO2 that was previously dissolved in the liquid comes out (there’s a reason we call soda a “carbonated” beverage). This is similar to what happens during a volcanic eruption where more and more CO2 comes out as the magma rises up to shallower depths in the volcano. Here, the amount of pressure the magma is under decreases as it moves to shallower levels in the volcano because there is less material on top of it.
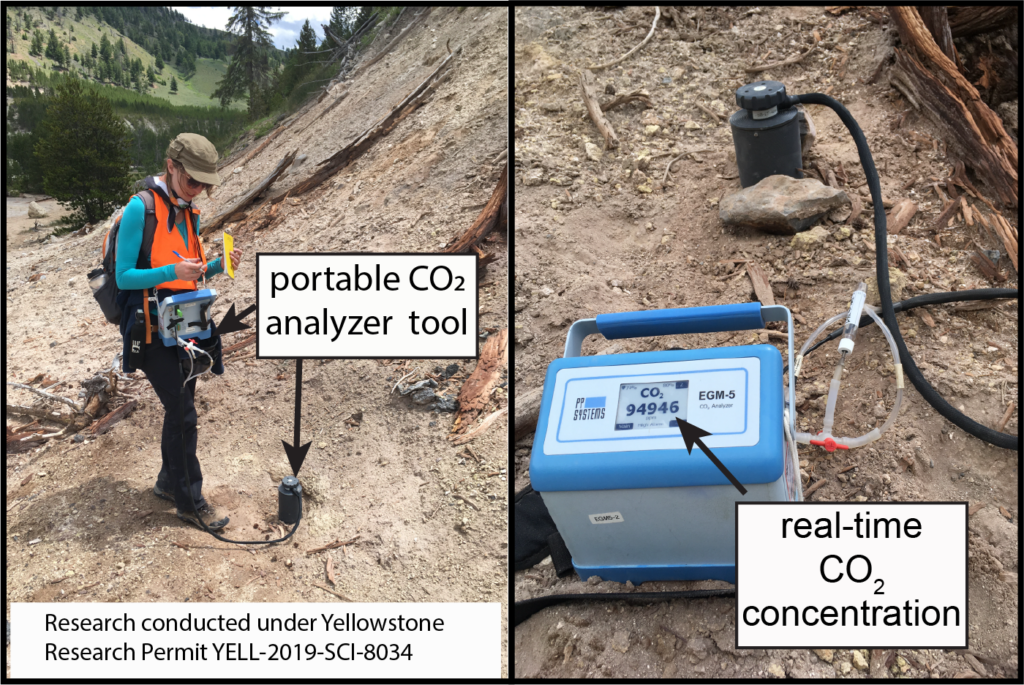
Even if magma is not really moving underneath a volcano, there is usually some amount of CO2 that can be measured at the surface due to a constant movement of CO2 from the Earth’s mantle, or the layer beneath the crust (where we live and read blog posts). If I asked you to draw a volcano right now, you would probably draw a cone-shaped mountain with a central hole in the top (called a vent) that has some stuff coming out of it. While CO2 comes out of these vents, it also comes out of the soils around these vents. I measure the amount of CO2 that comes out of volcanic soils using a portable CO2 analyzer (because, remember, CO2 is invisible and odorless, so we need special instruments to measure it). Specifically, I measure the flux of CO2. The flux is the amount of CO2 that comes out of a specific area of soil over a specific amount of time. My main scientific question is: how many tons of CO2 are released through the soils at Yellowstone National Park per day?
Doing the research!
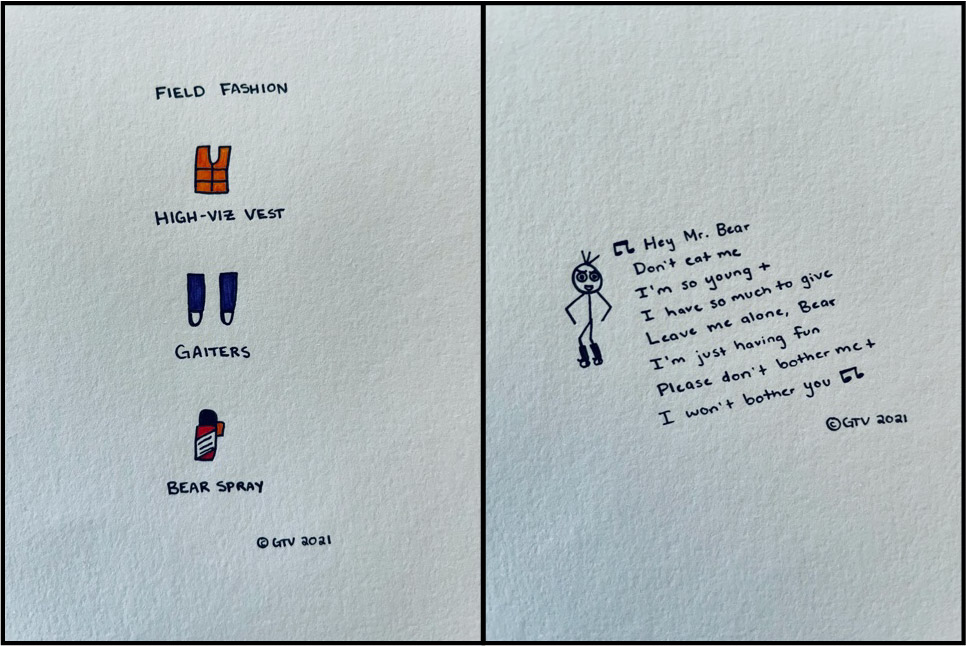
Now. Finally. We get to the fun part!! Actually doing the research! For this project, that meant spending a month traveling around Yellowstone National Park making CO2 flux measurements with two amazing undergraduate researchers and a colleague of mine from Vanderbilt University. That’s right! Science is always collaborative and, when you work in remote places in the field, it’s pivotal that you are with other people. This brings me to my next point: planning, planning, planning. At Yellowstone, we had to prepare for all types of weather and we had to bring safety equipment that is pretty unique to being in Yellowstone: gaiters and bear spray.

Gaiters are worn on your legs and we were required to wear them whenever we were next to high temperature pools (you know, just in case we stepped in the boiling water). Bear spray is needed because….Yellowstone has a lot of bears! In fact, there were large swaths of the park that we were not allowed to enter because of a high density of bears. I’m going to tell you all a secret (shhhh come in real close….) I’m terrified of bears. That’s right. Terrified! Part of our necessary field fashion (required by Yellowstone) is a can of bear spray, used to deter any charging bears. Yikes. We would sing as we walked through the woods so that we wouldn’t startle any bears….we wanted to let them know we were coming! In fact, there were a couple of times where we had to leave a site because of a bear nearby (and one time we thought a bear was behind us, only to surprise a bison coming out from behind a bush!)
Some challenges
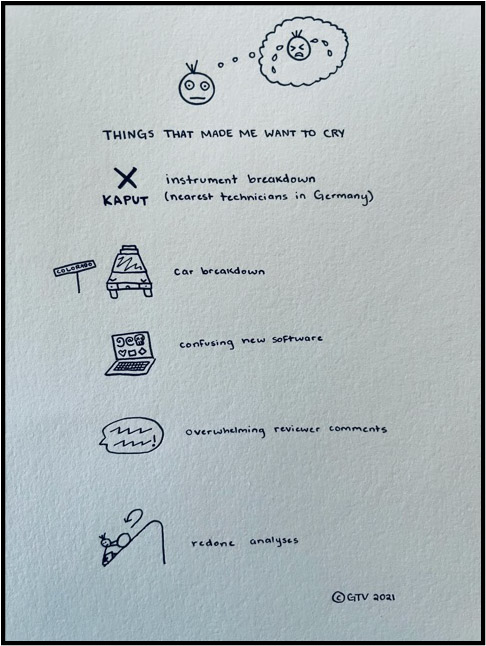
Field work is fun. But field work is also filled with challenges! For example, a week before we were going to leave Albuquerque, New Mexico for Yellowstone: one of the instruments we were going to bring stopped working. Unfortunately for us, this instrument can only be repaired by technicians in Germany….many thousands of miles away. Problem solving time! Luckily, the measurements we wanted to make could also be made in a laboratory at the University of New Mexico, we just had to bring our samples back to New Mexico with us. Phew!
Now what about the car ride from Albuquerque to Yellowstone. About half way there in Colorado….our car won’t start. Problem solving time! Luckily, we broke down next to a car repair shop (I know….what are the chances!) Two hours and one new battery later….we were back on the road. Phew!
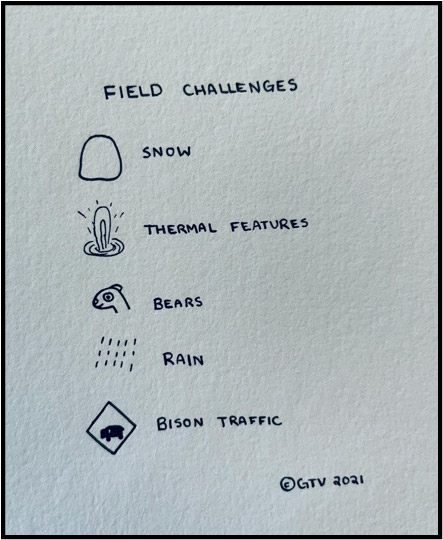
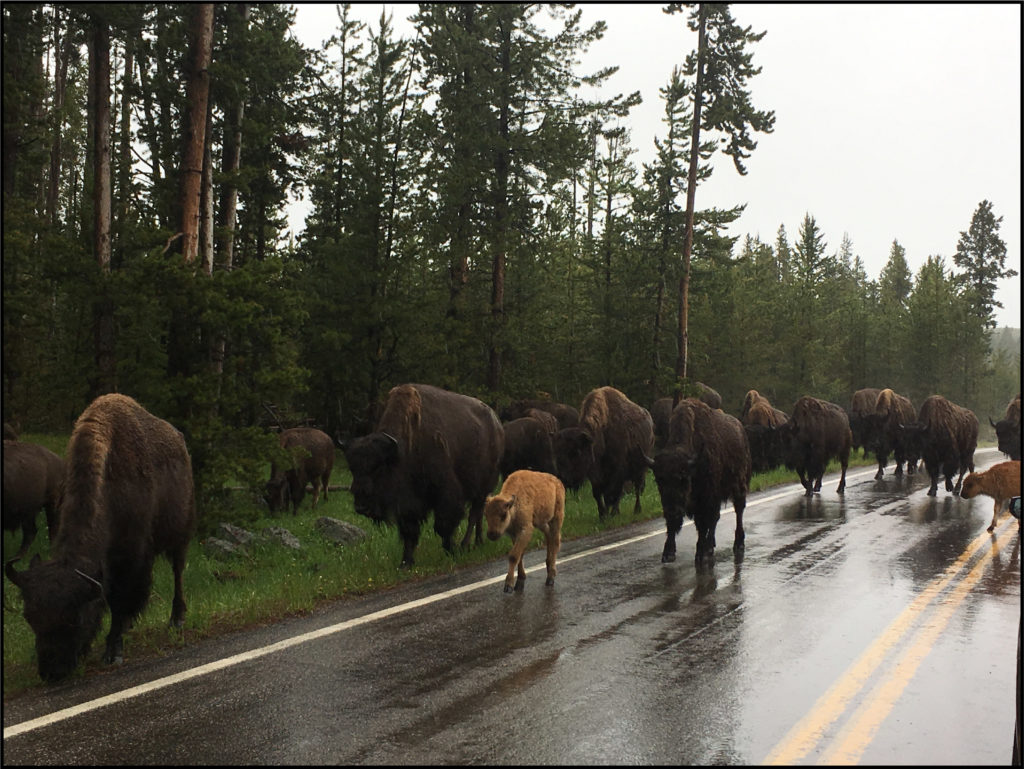
Finally, we are in Yellowstone. We are ready to head out for our first day of field measurements. How exciting! We get stuck in bison traffic…..and then it rains….and then it snows. So, what is bison traffic? It is literally a herd of bison that blocks traffic (or, more likely, causes tourists to stop on the road to take pictures). Having been in New York City for a year now, I can say I like bison traffic more than car traffic (though bison traffic will still make your 6 mile drive take an hour….)
Coming back home and making conclusions
Overall, we spent a month in the field. We took 1,342 CO2 flux measurements over 19 different sites in Yellowstone, exploring the variability in CO2 emissions across the park (and thinking about what it all meant). We took copious amounts of notes, met a lot of interesting people, and had help from the Yellowstone Park Rangers when we needed to work in an area highly visible to tourists (such as off the boardwalks near Old Faithful).
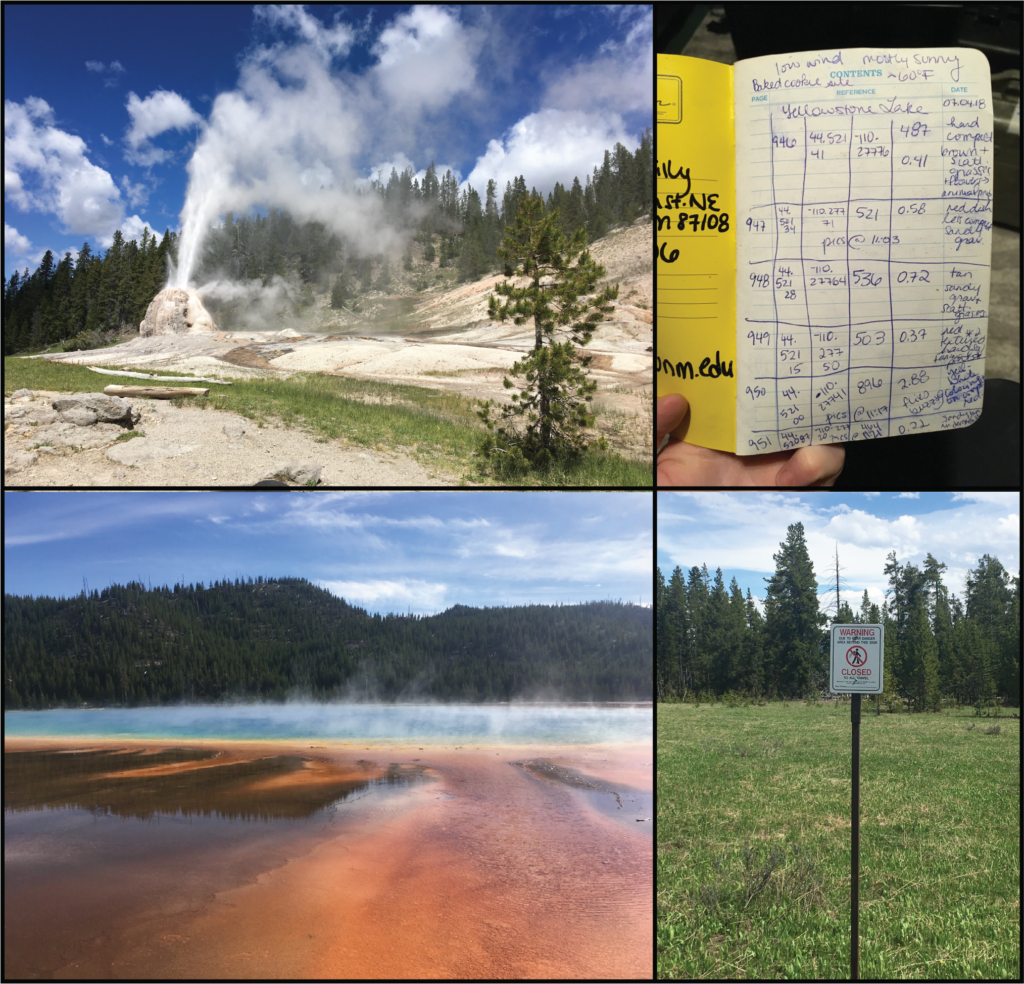
After coming back home to New Mexico with all of our measurements and samples, we were ready to write up our conclusions for the scientific literature, right? Not quite yet! When you come back from the field collecting data, it is often the case that you and your scientific collaborators need to analyze the data in some way. For us, this meant bringing some of our soil gas samples to a laboratory at the University of New Mexico to make some special composition measurements using stable isotopes (we will have a post on these in the future and Jess briefly talked about them in her post on carbonaceous chondrites). We also had to use a special computer software that would use statistics to predict what the CO2 flux values would be between the points that we actually measured (because we weren’t able to measure every square inch of Yellowstone).
So what did we conclude?
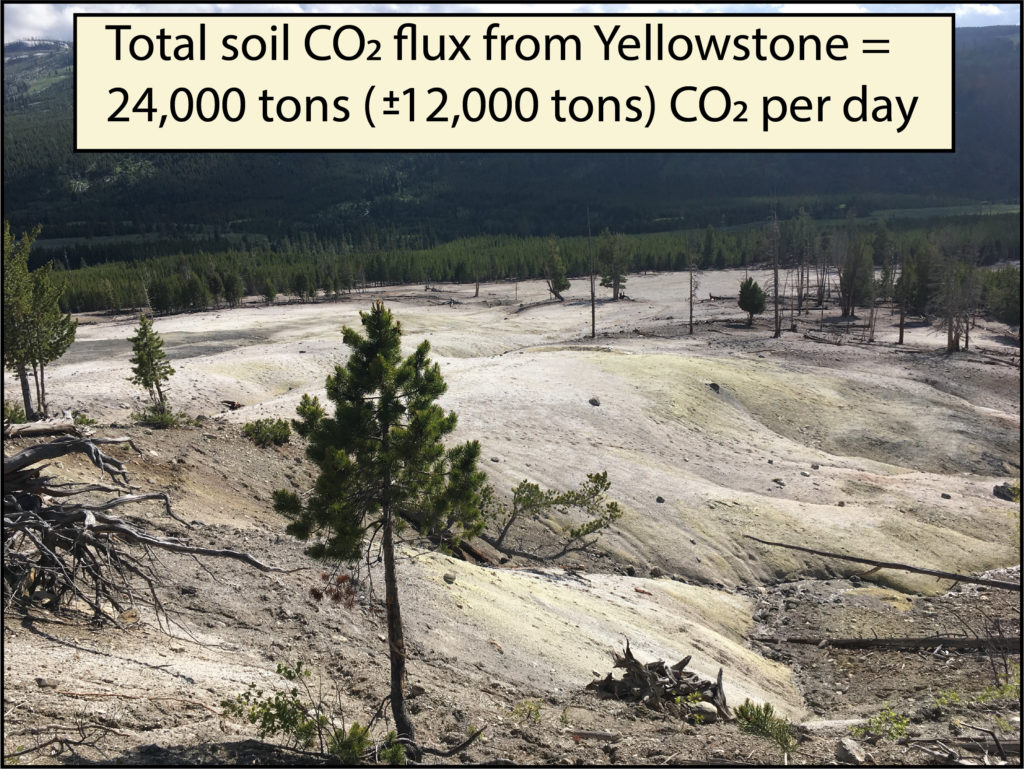
After all the planning, field work, measurements, and analysis, we concluded that the volcanic soils across Yellowstone National Park release 24,000 tons of CO2 per day2 (with an uncertainty of possibly 12,000 tons of CO2 per day…yes, good science always includes an estimate of how uncertain we are in our measurements!) Now, you may be thinking, this seems like a big uncertainty! Well, it is. The reason being that these measurements are so labor intensive that we can only measure a small portion of the total area and then have to extrapolate out to our entire area of interest. As technology gets better, we can use that technology to build on previous conclusions for how our Earth works! The most recent estimate for the amount of CO2 released through volcanic soils worldwide is 130,000 tons to 480,000 tons per day3. Yes! That much uncertainty! This also tells us that Yellowstone alone emits up to 28% of the CO2 emitted by volcanic soils worldwide!
Why do we care
So why do we care about the amount of CO2 that is released by volcanoes? Well, we know from our post for Earth Day 2021, humans are releasing more and more greenhouse gases like CO2, resulting in increasing global temperatures (and as of 2015, human activities emit approximately 110,000,000 tons of CO2 per day4). Volcanoes contribute a natural source of CO2 (and one that we can’t really eliminate). So it’s important to have an idea of what our natural baseline for CO2 emissions are so that we can better predict the massive, massive impact human-based CO2 emissions will have on our planet.
We also care about CO2 emitted through volcanic soils because many of the sites I measured at Yellowstone with very high soil CO2 concentrations don’t at all look like they are active or dangerous (like the site in Figure 5!). These soils can be cold and have no geysers or bubbling pools to warn you that volcanic gases are present. Sometimes, these soils can even have trees or other plants growing in them! So it is important that we measure these areas so that people know that they can be dangerous (people can exhibit signs of CO2 poisoning when exposed to 5,000 ppm or more for multiple hours….look back to Figure 2 to see just how much CO2 can be in volcanic soils!).
Sharing the science
After making conclusions and thinking about what these conclusions mean, your final step is to submit a written report (called a “manuscript”) to a professional scientific journal. To make sure that all of the science published is high quality, all manuscripts must undergo the peer review process. This means that our manuscript got sent to two scientific experts for review. These experts help the editor of the journal decide whether the manuscript should or shouldn’t be published. The reviewers will make comments and ask questions about your scientific methods, results, and conclusions. The editor of the journal we submitted to notified us after a couple of months that our manuscript was “accepted with moderate revision needed”. This means, we had to address ALL of the comments from the reviewers before resubmitting for editor approval. This process is HARD. It’s hard to hear critical comments about the research you’ve worked so hard on. Despite struggling through the emotional ups and downs of facing these criticisms, suggestions from the two reviewers helped our manuscript improve immensely. Two months later, we submitted our freshly edited manuscript and received word that it was approved for publishing!
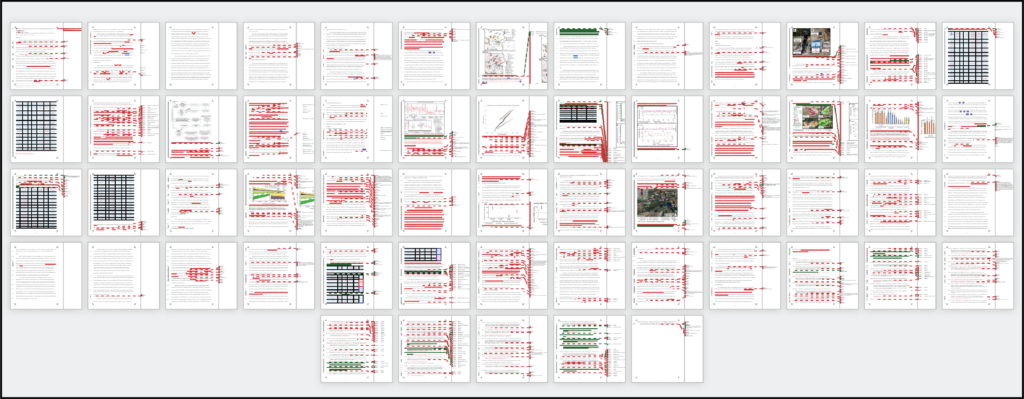
So that’s it! Three years after starting our Yellowstone project, the paper will be officially published in November 2021! You can check it out online for free until October 20, 2021 here: https://authors.elsevier.com/a/1dgKw1LkU3YVYA
Until next time, thanks for reading this week’s post! Now if you’ll excuse us, we have to get back to planning for our next scientific manuscript….
References:
1Papale, P., 1997. Modeling of the solubility of a one-component H2O or CO2 fluid in silicate liquids. Contributions to Mineralogy and Petrology, 126(3), pp.237-251.
2Rahilly, K.E. and Fischer, T.P., 2021. Total diffuse CO2 flux from Yellowstone caldera incorporating high CO2 emissions from cold degassing sites. Journal of Volcanology and Geothermal Research, 419, p.107383.
3Fischer, T.P., Arellano, S., Carn, S., Aiuppa, A., Galle, B., Allard, P., Lopez, T., Shinohara, H., Kelly, P., Werner, C. and Cardellini, C., 2019. The emissions of CO2 and other volatiles from the world’s subaerial volcanoes. Scientific Reports, 9(1), pp.1-11
4IPCC, 2021: Summary for Policymakers. In: Climate Change 2021: The Physical Science Basis. Contribution of Working Group I to the Sixth Assessment Report of the Intergovernmental Panel on Climate Change [Masson-Delmotte, V., P. Zhai, A. Pirani, S. L. Connors, C. Péan, S. Berger, N. Caud, Y. Chen, L. Goldfarb, M. I. Gomis, M. Huang, K. Leitzell, E. Lonnoy, J.B.R. Matthews, T. K. Maycock, T. Waterfield, O. Yelekçi, R. Yu and B. Zhou (eds.)]. Cambridge University Press. In Press.
